

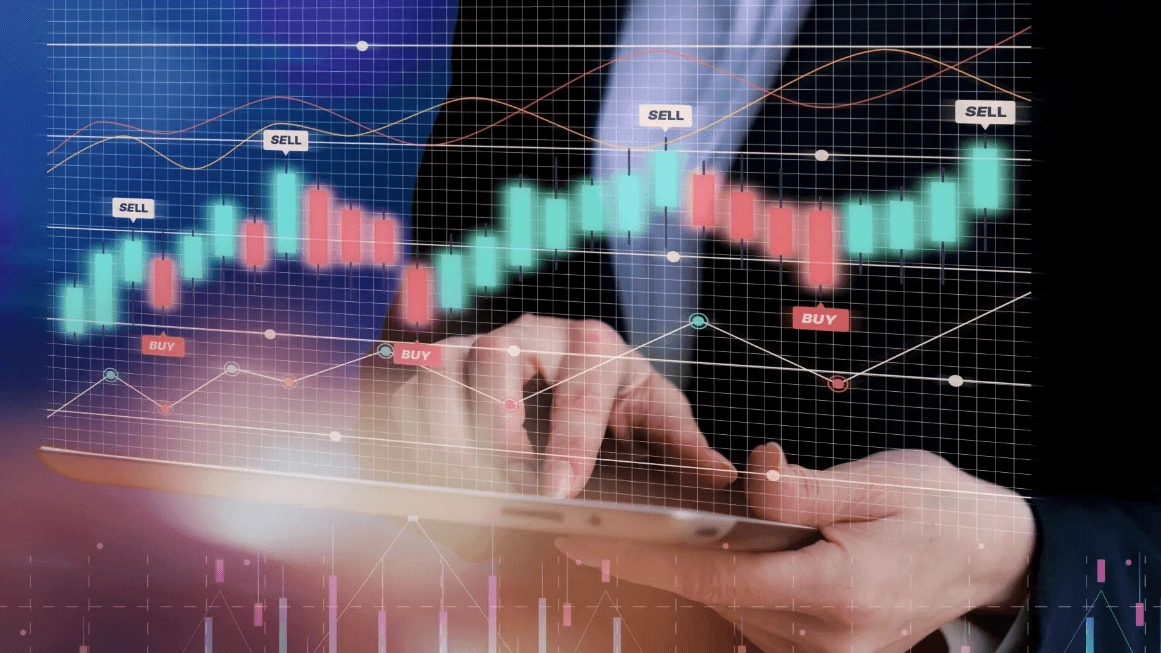
Candlestick Charts: Pros, Cons & What Most Traders Miss
Position holding is where most candlestick charts users go wrong—context is everything. Candlestick patterns alone won’t give you the full picture. They’re part of a larger ecosystem of price behavior, trend momentum, and, honestly, a bit of gut instinct. So let’s unpack this popular tool—what it does well, what it doesn’t, and how you can avoid the common traps.
The Pros of Candlestick Chart
They offer a visual shortcut to understanding price action. Candlestick charts condense a lot of information—open, close, high, and low—into a single, readable symbol. For many traders, especially those who lean visual, this is a huge plus.
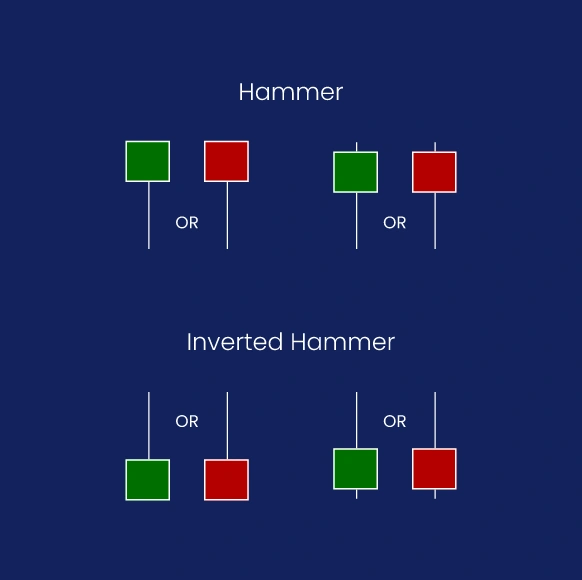
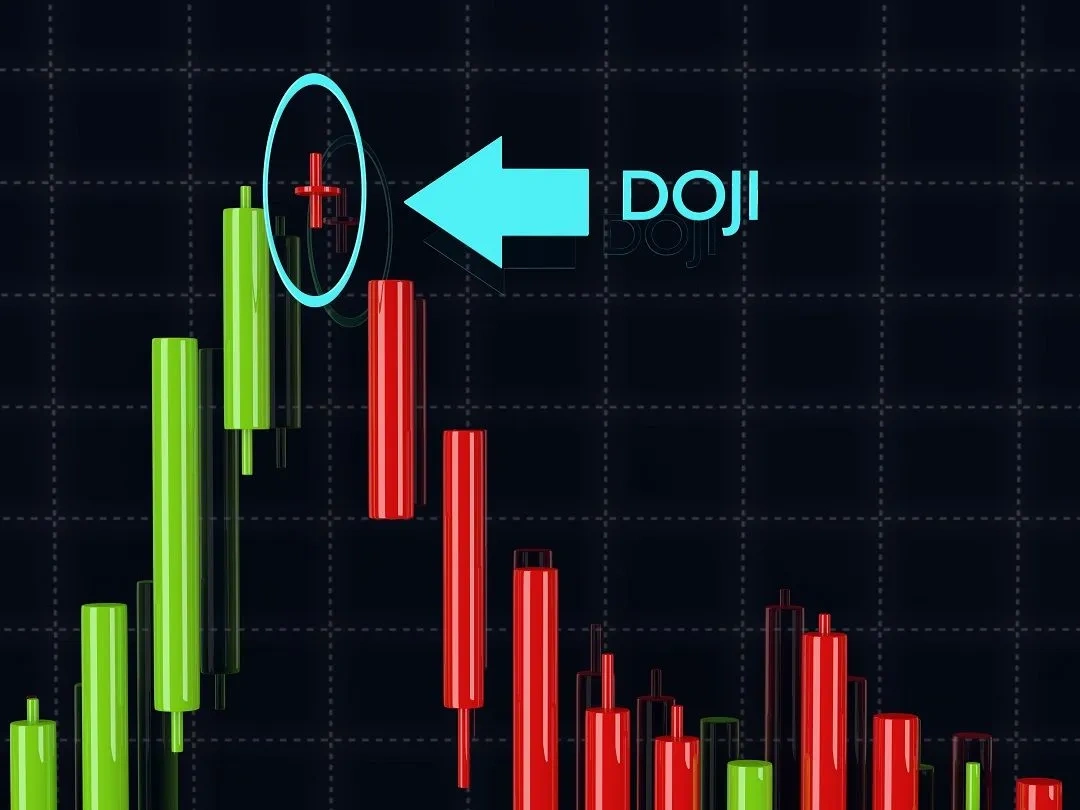
Patterns can give early clues about reversals or momentum shifts. Recognizing formations like the hammer, doji, or engulfing candle can sometimes signal a potential turn before it’s obvious on a line chart. They don’t predict the future—but they hint at possibilities.
They reflect trader psychology in real time. Long wicks? Indecision. Big bullish bodies? Confidence. The shape of each candle tells a tiny story of how buyers and sellers fought during that time period. It’s not perfect, but it’s revealing.
The Cons of Candlestick Chart
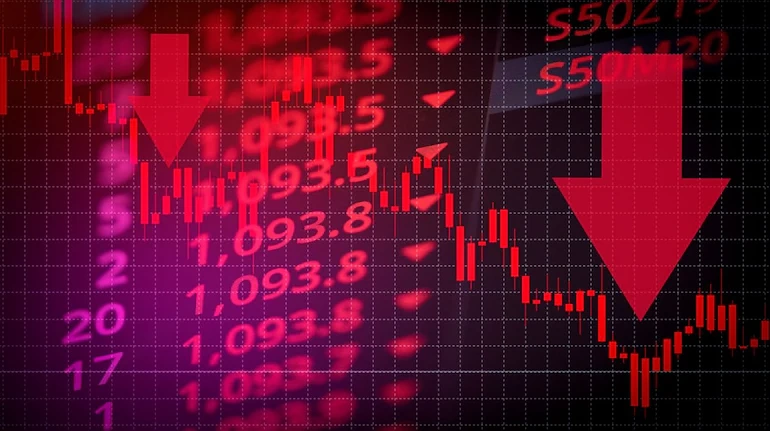
They’re easy to misread without considering position holding. A textbook “bullish signal” at the wrong place—say, during a downtrend—might lead to a bad trade. Context is everything. Position holding helps determine if a pattern means continuation or reversal… or nothing at all.
They can create false hope through over-reliance on pattern memorization. Just because a pattern can mean a trend change doesn’t mean it will. Many beginners treat candlestick patterns like absolute indicators, which leads to overconfidence—and losses.
They don’t stand alone—you still need volume, support/resistance, and trendlines. On their own, candlesticks are incomplete. They’re most effective when used with other tools to filter out noise and add confidence to your read.

Where Candlestick Charts Shine—and Where They Don’t
They’re fantastic for short-term analysis, less so for long-term investment strategy. Day traders and swing traders love candlesticks because they show price action in tight windows—minutes, hours, days. But for long-term investors? Weekly or monthly trends often matter more than intra-day candles.
They work well when you know what kind of market you’re in. Bullish engulfing in a strong uptrend? Possibly valid. Same candle in a choppy sideways range? Maybe not so much. Again, it all ties back to position holding—a concept too often ignored.

Final Thoughts: Should You Rely on Candlestick Charts?
They’re useful—if you know their limits. Candlestick charts give clarity, no doubt. But they’re not magic. They don’t replace solid risk management, they don’t eliminate uncertainty, and they certainly don’t “predict” the market.
What they can do is help you interpret sentiment, gauge momentum, and notice things that a basic line chart might miss. When paired with other indicators, and when used with a full understanding of position holding, they become a smart trader’s ally—not a crystal ball.
Keep your expectations realistic, stay skeptical of “perfect” setups, and let candlesticks be one of many tools in your trading kit—not the only one.
Relevant news: here